Two botanical extracts can report similar assay percentages while measuring different constituents. A green tea extract standardized to total polyphenols cannot be judged the same way as one standardized to epigallocatechin gallate (EGCG). HPLC, UV-Vis, titration and other techniques measure different properties, and each result has to be read alongside the target analyte, test procedure, reference standard and reporting basis. The key principle: compare what was measured, and how, before comparing percentages. This guide covers common assay techniques, how total-marker values are calculated, what makes a result reliable, and how to compare suppliers.
Why Assay Percentages Are Not Always Comparable
An assay percentage is a defined analytical measurement. It does not necessarily represent the total concentration of biologically active compounds or an extract’s overall quality, and different methods may quantify an individual compound, a group of related constituents or a broader chemical response. Our Green Tea Extract Powder illustrates this: its primary high-marker grade lists three analytical specifications.
| Analytical Parameter | Published Specification | Method |
|---|---|---|
| Tea Polyphenols | 98% | UV |
| Total Catechins | 80% | HPLC |
| EGCG | 50% | HPLC |
These are published commercial specifications, not results from an individual batch COA, and they describe different things. Tea polyphenols are a broad constituent category, total catechins a defined group of flavan-3-ols, and EGCG a single catechin. A formula that needs a specific EGCG level should be evaluated on an EGCG assay, not on the total-polyphenol figure. See also Green Tea Extract 40–98% Polyphenols.
Why the Analytical Target Matters
Some colorimetric procedures respond to several chemical substances rather than one constituent. The Folin–Ciocalteu assay, widely used for total phenolic content, responds to reducing substances in general. Platzer and colleagues (2021) showed in Antioxidants, in How Does the Phenol Structure Influence the Results of the Folin-Ciocalteu Assay?, why its response should not be read as an exclusive measure of polyphenol mass. That is a general analytical limitation; it does not show which UV procedure applies to our published green tea grade, which must be confirmed from the method documentation. The purchasing question is which measurement matches the required specification — the highest number on the sheet is beside the point.
What Does a Botanical Extract Assay Measure?
An assay quantifies a specified substance or constituent group under defined conditions — an individual marker such as EGCG or a broader fraction such as total silymarin. Assay data support standardization, incoming QC, formulation calculations and supplier qualification, but an assay alone does not establish botanical identity, overall purity or biological activity.
Assay, Potency, and Standardization
| Term | Meaning | Example |
|---|---|---|
| Assay | Quantitative measurement of a specified analyte | EGCG measured by HPLC |
| Potency | Strength or activity assessed through an appropriate chemical or biological measure | Marker concentration or measured biological activity |
| Purity | Proportion of a specified substance under an established analytical definition | Purity of an isolated phytochemical |
| Standardization | Control of an extract against defined constituent requirements | Milk thistle standardized to total silymarin |
A chemical assay can support a potency-related specification when the constituent is relevant, but it does not establish clinical efficacy — and 80% total silymarin is not 80% purified silybin.
Marker Compounds and Extract Ratios
Markers are chosen for characterization, standardization or QC; some are associated with biological activity, others serve mainly for identification or monitoring. An extract ratio such as 10:1 describes something else entirely — the relationship between botanical input and extract output under a manufacturing convention — and does not establish any marker’s concentration. When comparing standardized and ratio extracts, look at marker targets, assay methods, ratios, carriers and physical properties together, as our Specification & Grade Matching service does in ingredient selection and second-source evaluation. For background, see Active Compounds vs Marker Compounds.
HPLC, UV-Vis, and Other Botanical Assay Methods
Method selection starts with the substance or property being measured, not the instrument the lab happens to have. Methods differ in chemical selectivity and suit different constituents.
HPLC and UHPLC for Specific Compounds
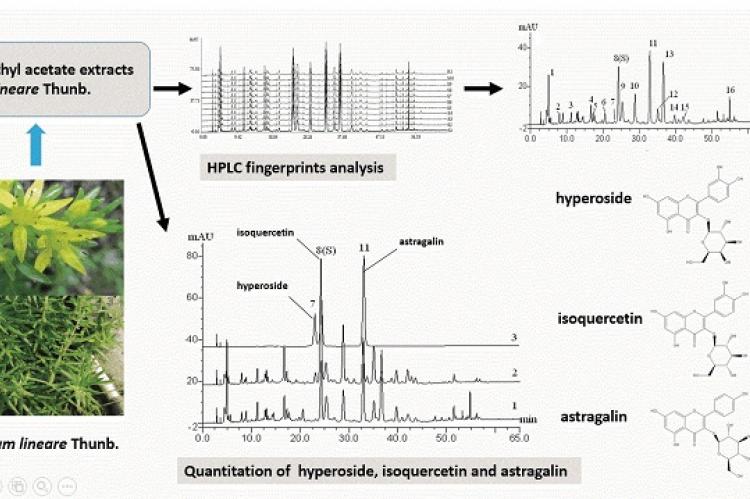
High-performance liquid chromatography separates the compounds in a sample before measuring them with a detector — ultraviolet, diode-array (DAD), fluorescence or mass spectrometry. UHPLC uses instrumentation and conditions designed for high-efficiency separations. Chromatography is especially useful when specifications call for individual markers or defined groups of separated compounds, such as EGCG, curcuminoids, silymarin flavonolignans and selected boswellic acids. But “HPLC” names a technique, not a complete quantitative procedure: accurate results also depend on sample preparation, separation, calibration, reference standards and calculation.
How Is Total Marker Content Calculated?
A “total” assay may be the sum of several individually quantified compounds. In this hypothetical HPLC total-catechin example:
| Individual Catechin (hypothetical) | Measured Content |
|---|---|
| EGCG | 320 mg/g |
| EGC | 180 mg/g |
| ECG | 90 mg/g |
| EC | 70 mg/g |
| Sum of the four compounds | 660 mg/g |
If the approved procedure defines the total as these four compounds, the result is 660 mg/g, or 66.0% w/w — assuming each was quantified appropriately on the same basis. Real methods may include more catechins or use different calibration conventions. ISO 14502-2:2005 describes an HPLC procedure that sums individually measured catechins; its scope covers leaf and instant green tea, with stated limitations for black tea, so for concentrated extracts buyers should confirm the procedure suits the actual matrix. A report of “total catechins by HPLC” should say which compounds are included and how they are calculated, and where one reference standard is used for several analytes, the relative response factors or other calibration conventions need checking.
UV-Vis and Other Analytical Techniques
UV-Vis spectrophotometry measures absorption of ultraviolet or visible light under defined conditions. It suits certain total-content assays, but substances with overlapping absorbance or similar reactivity can contribute to the result. Gas chromatography (GC) suits volatile, thermally stable constituents, and GC-MS adds mass-spectral information useful for identification. Gravimetric analysis weighs an isolated fraction; titration measures a chemical property through reaction with a standardized reagent. TLC and HPTLC are mainly used for identification and fingerprinting, and quantitative HPTLC needs its own method development and validation.
Botanical Testing Methods Compared
| Method | Best-Suited Measurement | What the Result Does Not Automatically Establish |
|---|---|---|
| HPLC / UHPLC | Individual markers and defined constituent groups | Complete extract quality or biological activity |
| UV-Vis | Defined absorbance-based assays | Individual compound concentration without sufficient selectivity |
| GC / GC-MS | Volatile constituents | Content of unrelated nonvolatile markers |
| Gravimetry | Mass of a defined isolated fraction | Identity of every substance within that fraction |
| Titration | Defined reactive groups or chemical properties | Individual constituent concentrations |
| TLC / HPTLC | Identity, fingerprints, selected quantitative assays | Quantitative content from a qualitative fingerprint alone |
HPLC and UV-Vis are not competing quality grades. HPLC is a separation technique and UV-Vis a detection approach — an HPLC system may itself use UV detection. The right procedure is whichever reliably measures the required target.
Method Scope and Matrix Suitability
An established standard method is not automatically right for every extract. A procedure developed for tea leaves or instant tea may need further suitability work before it is applied to a highly concentrated extract or a carrier-containing powder, because sample preparation, concentration range, matrix interference and recovery all affect results. This matters whenever labs transfer methods between materials with different compositions or processing histories.
What Supporting Evidence Makes an HPLC Result Reliable?
A chromatogram is useful but does not by itself prove a quantitative result is accurate. For critical specifications, quality teams may review:
| Analytical Evidence | What It Helps Establish |
|---|---|
| Method reference and revision | The precise procedure used for analysis |
| Chromatogram | Separation and retention behavior of relevant peaks |
| Peak identification | Basis for assigning a signal to the intended analyte |
| Reference-standard records | Calibration identity and assigned concentration |
| System suitability | Whether the system met method-specific performance criteria |
| Calculation records | How the reported concentration was determined |
System suitability may cover resolution, peak behavior or injection repeatability depending on the procedure. USP’s General Chapter <621> Chromatography describes chromatographic concepts and system suitability, but one method’s limits are not universal requirements for all HPLC procedures; assessment should consider the whole analytical process.
Reading Assay Results on a COA
On a Certificate of Analysis, connect the analyte, method, specification, actual result and reporting basis. A product specification defines what is required; a batch COA reports what was measured; a TDS gives broader technical information. Our full guide, How to Read a Botanical Extract COA, covers identity, traceability, contaminant results and documentation; three assay-specific points matter here.
Dry Basis vs As-Is Basis
Dry-basis results relate analyte content to dry sample mass; as-is results relate it to the material as received, including moisture. Under an appropriate mass-balance assumption, as-is assay = dry-basis assay × (1 − moisture fraction). In a hypothetical COA reporting EGCG at 41.2% on a dry basis with 4.0% moisture, the as-is value is 41.2% × 0.96 ≈ 39.55%.
| Purchasing Requirement (hypothetical) | Relevant Result | Assessment |
|---|---|---|
| NLT 40.0% EGCG, dry basis | 41.2% | Meets numerical limit |
| NLT 40.0% EGCG, as-is basis | 39.55% | Below numerical limit |
The same batch meets one requirement and fails the other. The conversion is valid only where analyte definition, moisture measurement and mass basis are compatible, and moisture and loss on drying are not automatically equivalent, since loss on drying can include volatiles other than water.
Units and Acceptance Limits
For the same analyte and basis, 1% w/w = 10 mg/g, so 50 mg/g = 5.0% w/w — though unit conversion never makes unrelated analytes equivalent. Specifications may use NLT (not less than), NMT (not more than) or a range, and batch results should be judged against the customer’s approved requirement, not just the supplier’s standard grade.
Results Near a Specification Limit
Results close to a limit should be judged under the applicable procedure and an established conformity decision rule. Against a hypothetical NLT 40.0% specification, 40.8% is above the minimum; 40.1% passes a simple numerical comparison but the final conformity statement depends on the decision rule and how uncertainty is treated; 39.9% is below and the limit should not be relaxed informally. Measurement uncertainty does not create an extra tolerance around an agreed specification. The International Laboratory Accreditation Cooperation’s ILAC G8 guidance covers decision rules and conformity statements; for borderline or disputed results, involve the quality team and testing laboratory.
Why Assay Results Vary Between Laboratories
Two labs can report different values for the same marker even with technically appropriate procedures, because of sample preparation, homogeneity, matrix interference, calibration, analytical variability or reporting conventions.
Sample Preparation and Matrix Effects
Botanical extracts are complex mixtures, and recovery depends on extraction solvent, temperature, preparation time, homogeneity and analyte stability. A method built for raw plant material may behave differently on a concentrated extract with carriers or excipients; poor separation can distort peak integration in chromatography, and other responsive compounds can inflate absorbance-based results. Investigate these factors before concluding that a discrepancy means defective material.
Method Validation and Reference Standards
Validation establishes that a procedure suits its intended use; verification checks that an established method performs under a given lab’s conditions. Relevant characteristics include accuracy, precision, specificity or selectivity, working range, quantitation limit and robustness. FDA’s final ICH Q2(R2) Validation of Analytical Procedures guidance is a recognized framework; its scope is pharmaceuticals, but the principles are useful for botanical methods. The identity, assigned purity and suitability of reference materials should also be considered when interpreting quantitative results.
Real-World Assay Examples
Three extracts show three distinct challenges: different targets, closely related constituents, and interference.
Green Tea: Marker Definition and Stability
Green tea extract contains EGCG, epigallocatechin (EGC), epicatechin gallate (ECG), epicatechin (EC) and other constituents, and as the specifications above show, total polyphenols, total catechins and EGCG are separate measurements. For an EGCG-standardized formula the individual marker assay is what matters; the polyphenol figure describes the broader profile. A batch COA also reports one point in time — EGCG stability can be affected by temperature, pH, oxygen exposure and formulation, so heat-processed beverages or long-shelf-life products may need stability information. Purchasing implication: confirm both the target marker and the ingredient’s suitability for the intended processing.
Milk Thistle: Total Silymarin vs Individual Flavonolignans
Milk thistle extract is made from the fruit of Silybum marianum (L.) Gaertn., and its silymarin complex includes silybin A and B, isosilybin A and B, silychristin and silydianin. Our Milk Thistle Extract Powder lists 80% total silymarin by UV as its primary specification. HPLC-standardized materials use a different analytical basis, and individual silybin values are separate measurements, so an 80% UV silymarin result should not be read as 80% silybin or assumed equal to an HPLC total. Chen and colleagues (2024) developed an HPLC procedure to separate and quantify silymarin flavonolignan isomers across 42 commercial batches, reporting fairly consistent isomer relationships including an average silybin B-to-A ratio of about 1.58 (Determination of Flavonolignan Compositional Ratios in Milk Thistle Extracts Using HPLC, Molecules) — an example of the constituent-level information chromatography adds beyond a single aggregate figure. Purchasing implication: define whether the material is controlled by total silymarin, a specified HPLC sum or an individual flavonolignan.
Boswellia: Total-Acid Titration and Analytical Interference
Boswellia serrata Roxb. extracts come from the oleo-gum-resin and contain pentacyclic triterpenoid acids such as 11-keto-β-boswellic acid (KBA) and acetyl-11-keto-β-boswellic acid (AKBA). Our Boswellia Serrata Extract 65–85% Boswellic Acids lists grades by titration, with 65% as the principal grade — a method-defined total-acid specification, not an HPLC measure of individual acids.
Püski and colleagues examined 14 commercial Boswellia serrata extracts in the Journal of Dietary Supplements, using HPLC for KBA and AKBA, titration for total boswellic acids, and UHPLC-HRMS and ¹H NMR to investigate composition. Only two products met the study’s KBA and AKBA criteria. Although total-acid titration values matched expectations, 10 extracts contained roughly 6–11% citric acid, which is not characteristic of the botanical, indicating that undeclared citric acid could influence titration results (Rapid Detection of Adulteration in Boswellia Extracts with Citric Acid). The study does not show that all commercial boswellia is adulterated or that every titration is unsuitable; it shows that a total-acid result cannot by itself establish specific boswellic acid content.
| Analytical Approach | Measurement | Purchasing Interpretation |
|---|---|---|
| Total-acid titration | Method-defined acidic response | Relevant to the agreed total-acid specification |
| HPLC for KBA | Individual KBA concentration | Supports KBA-specific requirements |
| HPLC for AKBA | Individual AKBA concentration | Supports AKBA-specific requirements |
| Complementary chemical profiling | Broader constituent composition | Helps investigate unexpected analytical results |
Purchasing implication: when AKBA or another individual acid is required, request compound-specific analytical evidence. In each example, the real question is whether the measurement reliably describes the characteristic the formula needs.
Comparing Assay Results Across Suppliers
Establish analytical equivalence before looking at price, availability or order quantity; a higher reported assay does not by itself mean a more suitable ingredient.
Supplier A vs Supplier B
| Evaluation Parameter (illustrative) | Supplier A | Supplier B |
|---|---|---|
| Botanical Source | Camellia sinensis leaf | Camellia sinensis leaf |
| Target Analyte | EGCG | EGCG |
| Reported Assay | 40.8% | 42.0% |
| Technique | HPLC-UV | HPLC-UV |
| Method Documentation | Available for review | Incomplete |
| Reporting Basis | Dry basis | Not stated |
| Initial Decision | Continue technical review | Request clarification |
Supplier B reports more, but with incomplete method details and no stated basis the two cannot yet be compared. Once targets, procedures and conventions are aligned, conformity with the approved specification and commercial terms can be assessed.
Comparing Cost per Standardized Marker
When results are genuinely comparable — here assume the same method and as-is basis — marker concentration helps with ingredient economics: cost per kg of marker = price per kg of extract ÷ marker mass fraction.
| Comparison (illustrative prices, not quotations) | Supplier A | Supplier B |
|---|---|---|
| EGCG Content | 40.8% | 42.0% |
| Extract Price | $100/kg | $110/kg |
| EGCG per kg of Extract | 0.408 kg | 0.420 kg |
| Calculated Cost per kg of EGCG | $245.10 | $261.90 |
Supplier B has slightly more EGCG, yet Supplier A gives a lower theoretical cost per kilogram of EGCG ($100 ÷ 0.408 vs $110 ÷ 0.420). The calculation ignores shipping, processing losses, marker stability, formulation performance and other requirements, and holds only when results and purchasing conditions are comparable.
Comparing Results Across Commercial Batches
A single passing COA does not establish long-term consistency. In this hypothetical series (same analyte and basis assumed), Lot 001 reports 41.2% and Lot 002 40.8% by HPLC Method A, while Lot 003 reports 42.1% by Method B. Before comparing Lot 003 with earlier lots, establish whether the new method gives comparable measurements; method changes may need technical review or a method comparison. Our Sourcing & Traceability page notes that changes in supplier, processing, specification, carrier or analytical method should be reviewed when they could affect consistency.
Resolving Conflicting Laboratory Results
When labs disagree, first confirm that samples, methods, calibration conventions and reporting bases are comparable. If a significant discrepancy remains, supporting records or suitably scoped independent testing may be needed. Retesting should find the cause of the difference rather than pick the more favorable number, and the final decision should rest on the approved specification, evidence, formulation needs and quality procedures.
What Buyers Should Request Before Approval
| Document or Information | Purpose |
|---|---|
| Approved Product Specification | Defines material characteristics and acceptance limits |
| Batch-Specific COA | Reports results linked to the relevant lot |
| Analytical Method Reference | Identifies how the target analyte was measured |
| Reporting Units and Basis | Clarifies concentrations and calculation conventions |
| Reference-Standard Information | Supports calibration and quantification review |
| Supporting Laboratory Records | Helps investigate critical or unexpected results |
| Third-Party Test Report | Provides additional verification when appropriate |
A representative specification and COA can support preliminary grade evaluation, but commercial approval should use documentation for the material actually supplied.
Laboratory Competence and Regulatory Considerations
Where independent testing is used, confirm the lab’s technical capability and, if accreditation is relied on, that the method is within its accreditation scope. Regulatory obligations depend on activity, ingredient category and market. For U.S. dietary supplement manufacturers, 21 CFR §111.75 sets requirements for determining whether specifications are met. Under defined conditions — establishing supplier reliability, obtaining method and actual-result information, documenting qualification and periodically reconfirming COA reliability — manufacturers may rely on supplier COAs for certain component specifications, but dietary ingredient identity verification has separate requirements and generally cannot be replaced by a supplier COA. These provisions are not universal rules for every ingredient category or market.
Applying Assay Requirements to Sourcing
Our Quality & Testing approach evaluates materials by target analyte, product characteristics and agreed specification, and our Compliance & Documentation page explains how specifications, COAs, TDS and supporting documents relate. Buyers should confirm which records and analytical evidence exist for the particular ingredient, grade and batch. Useful starting information for a sourcing project is the botanical name, plant part, target marker, assay requirement, preferred method, application, destination market and expected quantity — enough to set a common technical basis before samples and terms are compared. Where a defined marker level must be built into the grade, our Processing & Standardization service applies.
Making an Informed Assay Comparison
HPLC, UV-Vis, titration and other techniques are each useful for the right purpose, but their results should never be compared by percentage alone. Confirming analytical targets, reporting conventions, method suitability and batch-specific evidence lets purchasing teams make better decisions on comparability, supplier qualification and cost.
Request Specifications, COAs or Samples
Need an extract with a defined assay specification? Browse our Standardized Extracts, then contact Essencefield Botanicals to discuss target markers, analytical methods, available documentation and samples.